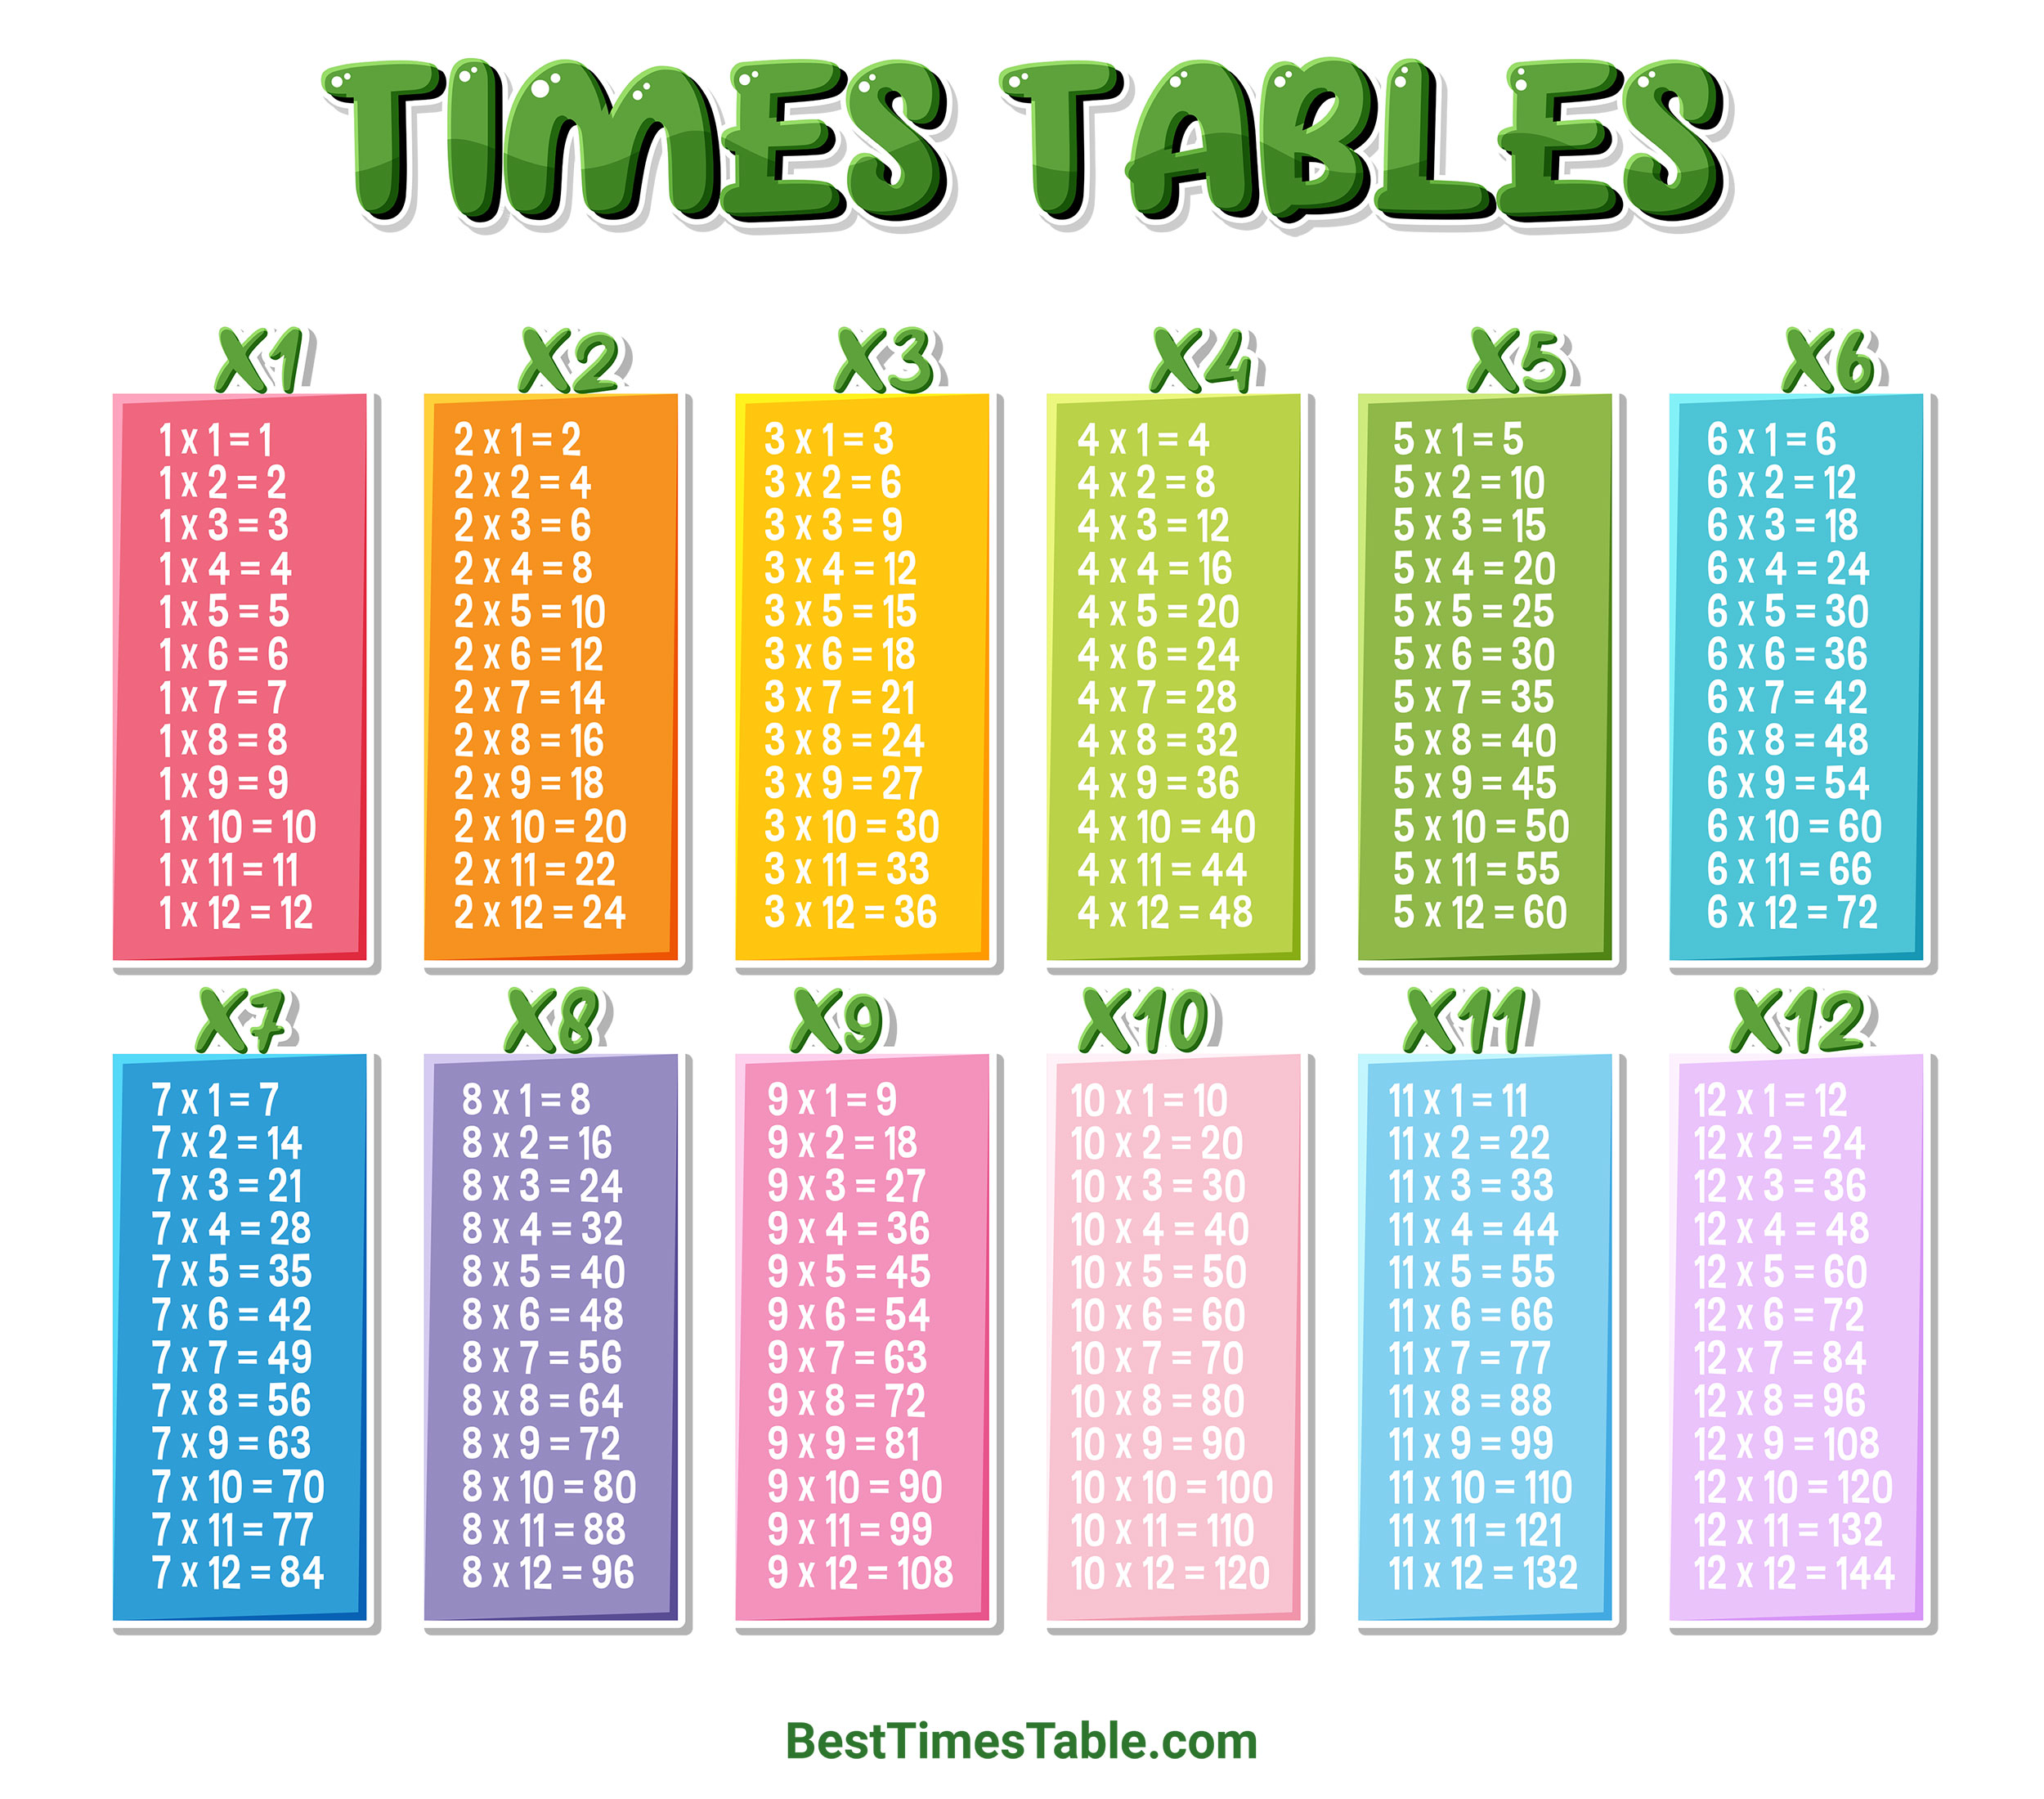
A multiplication chart is a simple grid that helps you find and understand multiplication facts quickly. Choose a number across the top and another down the left side, then follow the row and column to the point where they meet.
Use the interactive multiplication chart below to explore facts from 1 × 1 to 12 × 12, or switch to larger 20 × 20 and 30 × 30 charts. You can also hide the answers to turn the chart into a practice activity or print a clean version for offline learning.
How to read the chart
Choose one number from the top and one from the left. Their intersection gives the product.
For example: 7 × 8 = 56
Interactive learning tool
Interactive Multiplication Chart
Choose a chart size, then hover or tap a multiplication fact to explore its row and column.
How it works
How to Use a Multiplication Chart
A multiplication chart organizes multiplication facts into rows and columns. The numbers across the top are one set of factors, while the numbers down the left side are the other set.
To find a product, locate both factors and follow them until the row and column meet.
3 × 4 = 12
6 × 7 = 42
9 × 8 = 72
To find 7 × 8, locate 7 on one side of the chart and 8 on the other. Follow the row and column until they meet at 56.
In the interactive chart above, hovering over a multiplication fact highlights its row and column. Clicking a cell also displays the full equation.
Start with the right size
12×12, 20×20 or 30×30 Multiplication Chart?
The 12×12 multiplication chart is the best place to start because the multiplication tables from 1 through 12 are commonly used for learning basic multiplication facts.
Basic practice
Extended practice
Advanced reference
The larger charts are useful when you want to explore multiplication beyond the standard tables, but they contain many more cells and are naturally more difficult to read on a small screen.
Use the size buttons above to switch between the charts without reloading the page.
Practice mode
Hide the Answers and Test Yourself
A multiplication chart does not have to be used only as a reference. You can also turn it into a simple practice activity.
Select Hide answers in the interactive chart. The products will disappear, and you can try to work out each answer before clicking the cell to reveal it.
See 6 × 8?
Try to answer it mentally first.
Then click the cell to check whether you got 48.
This method encourages active recall rather than simply reading the answers from the chart.
Look for relationships
Patterns You Can Find in a Multiplication Chart
One advantage of displaying multiplication facts in a grid is that number patterns become easier to see.
The chart is symmetrical
The multiplication chart has the same values on either side of its main diagonal because multiplication works in either order.
= 21
= 21
= 4 × 8
This is called the commutative property of multiplication. It means you do not need to learn 3 × 7 and 7 × 3 as two separate facts.
Square numbers appear on the diagonal
When a number is multiplied by itself, the result is called a square number. These facts form the main diagonal of the chart.
1 × 1 = 1
2 × 2 = 4
3 × 3 = 9
4 × 4 = 16
5 × 5 = 25
6 × 6 = 36
The pattern continues through facts such as 8 × 8 = 64, 10 × 10 = 100 and 12 × 12 = 144.
Even-number rows contain only even products
Rows for even numbers such as 2, 4, 6, 8 and 10 contain only even products. For example, the 6 times table includes 6, 12, 18, 24, 30 and 36.
The 5 and 10 rows have easy endings
Multiples of 5 end in 0 or 5, while whole-number multiples of 10 end in 0. These repeating digit patterns are easy to recognize visually in the chart.
Free downloads
Free Printable Multiplication Charts
Prefer to practice away from the screen? Download a printable multiplication chart in color or black and white.
Printable chart
Color Multiplication Chart
A colorful multiplication grid for classroom, homework or home practice.
Printer friendly
Black & White Multiplication Chart
A simple version designed for easy printing without color.
Times tables reference
Printable Times Tables
A traditional list-style reference showing the multiplication tables together.
Practice efficiently
How to Learn Multiplication With the Chart
You do not need to memorize the entire chart at once. A better approach is to use it to identify patterns and gradually reduce how often you need to look at the answers.
1. Start with easier tables
2. Follow one row at a time
3. Hide the answers
4. Focus on facts you miss
5. Practice without the chart
Choose a table
Practice Individual Times Tables
If you want to focus on one multiplication table, choose it below. Each lesson includes the table itself, practice questions, mistakes review and a timed test.
Extended times tables
Quick answers
Multiplication Chart Questions
What is a multiplication chart?
A multiplication chart is a grid showing the products of two numbers. One factor is selected from the top row and another from the left column, and the cell where they intersect contains the product.
What is a 12×12 multiplication chart?
A 12×12 multiplication chart contains multiplication facts from 1 × 1 through 12 × 12. Its largest product is 12 × 12 = 144.
How do I find 7 × 8 on a multiplication chart?
Find 7 on one axis and 8 on the other, then follow the row and column to their intersection. The result is 56.
Why is a multiplication chart symmetrical?
Multiplication can be performed in either order. For example, 4 × 7 and 7 × 4 both equal 28. This creates matching values on opposite sides of the main diagonal.
What are the diagonal numbers in a multiplication chart?
The main diagonal contains square numbers because each number is multiplied by itself. Examples include 2 × 2 = 4, 5 × 5 = 25, 8 × 8 = 64 and 12 × 12 = 144.
Can I print the multiplication chart?
Yes. Use the Print chart button in the interactive tool or download one of the printable PDF versions above.
Should I use a 12×12 or 30×30 multiplication chart?
A 12×12 chart is usually the best choice for learning standard multiplication facts. The 20×20 and 30×30 charts are useful as extended references once the basic tables are familiar.